
San Francisco 49ers vs Atlanta Falcons, NFL Picks

All stats are publicly graded and pulled from real sportsbook accounts.
 TEP12NFL Record: 621 - 372
Golf+$10k
NFL+$8k
MLB+$2k
Market Action
SF @ ATL
Live odds tracking
SF

OWLS INSIGHTAPI / DATA10% OFF First 3-Months
✓Betting Splits✓Real-Time Odds✓Websocket Push
Model Projection
These numbers come from a power-rating model built on the method Billy Walters lays out in his book Gambler.
Projected Spread
SF -7
Market
SF -4 (-110)
Projected Total
48.5
Market
49.5 (O -110 / U -105)
Projected Moneyline
SF -240
Market
SF -205
This projection and current market action are supplementary and do not influence the final qualitative pick and analysis of today's game.
Season stats ordered from most to least relevant. Longer bar, stronger league standing.
SFATL
Matchup Breakdown
San Francisco's offense: The 49ers are among the most efficient finishing offenses in the league during the 2026 season, converting third downs at the best rate of any team and turning red zone trips into touchdowns better than anyone. They score at a high clip and are reasonably careful with the football.
Atlanta's offense: Atlanta has one of the most productive rushing attacks in the league, but their passing game sits well below average. They move the ball and score at a respectable rate, though they give the ball away at one of the higher rates in the league during the 2026 season.
San Francisco's defense: The 49ers have been one of the stingiest defenses in the league, allowing among the fewest points and yards of any team while holding up well against both the pass and the run. They also generate turnovers at an above-average rate, adding another layer of trouble for turnover-prone opponents.
Atlanta's defense: Atlanta is one of the best teams in the league at stopping the run, but their pass defense has been among the most generous units all season. They also rank among the worst at creating takeaways, a significant liability against a high-scoring, ball-controlling offense.
Overall: San Francisco holds the clearer edge across both sides of the ball. Their offense converts at the top of the league and excels at finishing drives, putting them directly against Atlanta's pass defense, which has been one of the most generous units all season. Atlanta's run game is a legitimate strength, but it faces a defense that handles it well, and a turnover-prone offense going against a unit that takes the ball away consistently makes sustained scoring a tall order.
Quarterback Matchup
The two starters, and how each has actually played.
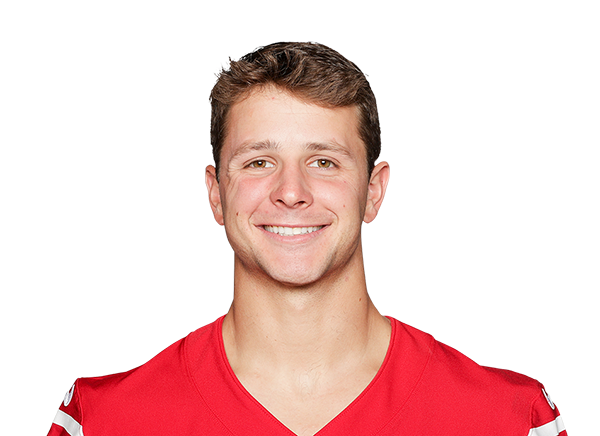
Brock Purdy
QB #13 · SF
2026 season numbers
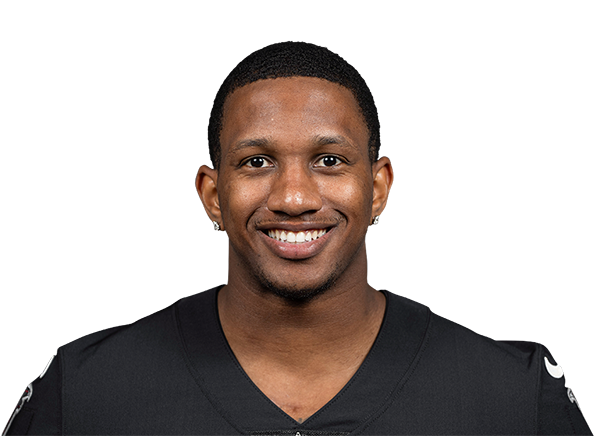
Michael Penix Jr.
QB #9 · ATL
2026 season numbers
The Read
San Francisco's quarterback: Brock Purdy has been among the sharpest passers in the 2026 season, with a completion rate and touchdown-to-interception ratio that reflect consistent, low-mistake football. He converts possessions into scores rather than simply moving the chains.
Atlanta's quarterback: Michael Penix Jr. has shown genuine downfield ambition in the 2026 season, generating more yards per attempt than Purdy, but his touchdown production has been modest relative to his passing volume. The arm talent is present; the red-zone conversion has not kept pace.
The protection: Both lines have kept their quarterback reasonably clean, though Penix has absorbed more sacks than Purdy through the 2026 season. Against a San Francisco defense that generates pressure reliably, that difference in protection is not trivial.
Overall: Purdy holds the clearer edge under center, and the separation is less about raw yardage than about scoring efficiency. Both quarterbacks have moved the ball at a nearly identical rate, but Purdy has turned those drives into touchdowns at a far higher clip, which is the gap that matters most when a game is decided by a possession or two.
Team Conditions
Schedule rest, recent form, and the current injury report.
SFATL
Rest
Standard week of preparation, 5 days rest.
Standard week of preparation, 7 days rest.
Form
2026 record 5-0 (home 3-0, road 2-0)
2026 record 2-3 (home 0-2, road 2-1)
InjuryKey Players
None reported
C.J. Henderson (CB) - OCT 17 · Out
Z. Smith (DE) - OCT 17 · Questionable
Y. Abdullah (LB) - OCT 11 · Injured Reserve
The Read
San Francisco's availability: San Francisco carries no notable injury concerns into this game and enters with a full roster across all position groups.
Atlanta's availability: C.J. Henderson is ruled out at cornerback, leaving a real gap in Atlanta's secondary, and a defensive lineman carries an uncertain designation for the game. A linebacker already sidelined on injured reserve adds to the defensive attrition across multiple levels of their unit.
Rest and form: Both teams had a standard preparation week, though Atlanta benefited from a slightly longer rest period. San Francisco has been one of the steadiest teams in the 2026 season, winning every game they have played, while Atlanta has struggled at home and carries a losing record overall.
Overall: San Francisco enters this game better positioned on nearly every front, with full health, consistent form throughout the 2026 season, and road wins already established. Atlanta's defensive absences and a pattern of home losses add real pressure on their ability to hold serve. The conditions across roster availability, recent results, and momentum all favor the visiting side.
Weather & Stadium
Game-time conditions and whether they actually matter here.
Mercedes-Benz Stadium
Indoor
Roof: Indoor stadium, weather is not a factor tonight
The Read
The stadium: Mercedes-Benz Stadium is a fully enclosed indoor venue, meaning temperature, wind, precipitation, and humidity are all controlled and irrelevant to tonight's contest.
The conditions: The retractable roof eliminates any environmental variable that could affect passing, kicking, or ball handling, leaving the game entirely in the hands of the two rosters.
Overall: Indoor conditions produce no weather-driven lean on the total in either direction. San Francisco and Atlanta will play in a neutral environment where scheme, personnel, and matchup quality are the only forces at work. The over/under rests entirely on the football itself.
Side Write-Up
San Francisco enters Mercedes-Benz Stadium as the cleaner team on both sides of the ball, and the evidence stacks in one direction across the board. The 49ers have won every game in the 2026 season, while Atlanta carries a losing record with a particular pattern of struggling at home. Brock Purdy has been the more efficient quarterback, converting drives into touchdowns at a far higher rate than Michael Penix Jr., whose arm talent has not translated into red zone production. Atlanta's pass defense has been one of the most generous units in the league during the 2026 season, which is precisely the weakness that San Francisco's top-ranked red zone offense targets most naturally. The 49ers also enter fully healthy, while Atlanta is missing a starting cornerback outright and carries uncertainty along their defensive line, thinning a unit that already gave up points through the air. The strongest counterargument is Atlanta's run game, which ranks among the best in the league, but it runs directly into a San Francisco defense that has been among the best at containing the run throughout the 2026 season. A turnover-prone Atlanta offense facing a defense that generates takeaways at an above-average rate only compounds the trouble for the home side at -4.5.
Final PickSan Francisco -4.5
Total Write-Up
The case for the over rests on a structural mismatch that benefits scoring on at least one side and likely both. San Francisco's offense is the most efficient finishing unit in the league during the 2026 season, converting third downs at the top rate of any team and turning red zone trips into touchdowns better than anyone, and it faces an Atlanta pass defense that has been one of the most generous units in the league during the 2026 season. Atlanta's offense, despite a below-average passing game, moves the ball behind one of the best rushing attacks in the league and scores at a respectable rate. The indoor setting at Mercedes-Benz Stadium eliminates every environmental variable that could suppress scoring, placing the outcome entirely on scheme and personnel. Atlanta's turnover issues create a natural cap on their output, but San Francisco's elite red zone efficiency against Atlanta's permissive secondary already carries significant scoring weight on its own. The strongest counterargument is San Francisco's defense, which has allowed among the fewest points and yards of any team in the 2026 season and could suppress Atlanta's side of the total entirely. That unit does limit Atlanta, but the 49ers offense operates above any defense's ceiling against a secondary this exposed, and even moderate scoring from Atlanta's run-first attack is enough to close the gap to 49.5.
Final PickOver 49.5

Written by
VIMB
47,000+
Followers Across All Socials
17+
Brand Partners
3+
Years Experience
1,000+
Games Tested
This information is for entertainment purposes only and is not any form of financial or gambling advice. Sports involve high variance therefore always be responsible and manage your risk accordingly.
All stats are publicly graded and pulled from real sportsbook accounts.
TEP12NFL Record: 621 - 372Golf+$10k
NFL+$8k
MLB+$2k
Tools
Loading tools…
Other games this week
 NFL
 VS
 Houston Texans vs Jacksonville Jaguars9:30 AM ET›NFL
 VS
 Chicago Bears vs Atlanta Falcons1:00 PM ET›NFL
 VS
 Baltimore Ravens vs Cleveland Browns1:00 PM ET›NFL
 VS
 Tennessee Titans vs Indianapolis Colts1:00 PM ET›NFL
 VS
 New York Jets vs New England Patriots1:00 PM ET›NFL
 VS
 New Orleans Saints vs New York Giants1:00 PM ET›NFL
 VS
 Carolina Panthers vs Philadelphia Eagles1:00 PM ET›NFL
 VS
 Pittsburgh Steelers vs Tampa Bay Buccaneers1:00 PM ET›NFL
 VS
 Arizona Cardinals vs Los Angeles Rams4:05 PM ET›NFL
 VS
 Los Angeles Chargers vs Kansas City Chiefs4:25 PM ET›NFL
 VS
 Buffalo Bills vs Las Vegas Raiders4:25 PM ET›NFL
 VS
 Dallas Cowboys vs Green Bay Packers8:20 PM ET›
Free Promos for Your Next Bet!
Current offers for your area. Pick your region and the list updates.
Select Your Location